Friday, July 27, 2018

Basic SQL

Entity Relationship Diagram(ERD): 
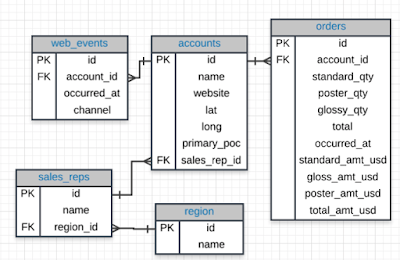
ERD is a common way to view data in a database.
It helps you visualize the data you are analyzing including:

  1. the names of the tables.
  2. the columns in each table
  3. the way the tables work together


SQL (Structured Query Language)

  • easy to understand
  • access data directly
  • easy to audit and replicate
  • multiple tables at once
  • allows you to analyze more complex questions than dashboard tools like Google Analytics


Why Do Business Choose SQL?

  1. Data integrity is ensured. 
  2. Data can be accessed quickly. 
  3. Data is easily shared. 


Types of Statements

  1. Create table: creates a new table in a database
  2. Drop table: removes a table in a database
  3. Select - query: allows you to read data and display it. 


Select & From

  • Select: tell the query what columns you want back. 
  • From: what table you are querying from. 


select *
from demo.order

Queries
LIMIT

  • seeing only a few lines of data 
  • in MySQL, used as 


select top 10 *
from orders;

ORDER BY

  • order out table by any row 
  • default: ascending order / put 'desc' at the end for descending order

select *
from web_events
order by occurred_at desc


  • create an order within the order

select occurred_at, total_amt_usd
from orders
order by total_amt_usd desc, occurred_at desc
limit 5

WHERE
subset out tables based on conditions that must be met. 
when finding non-numeric values, put a single quotation mark
  1. > (greater than)
  2. < (less than)
  3. >= (greater than or equal to)
  4. <= (less than or equal to)
  5. = (equal to)
  6. != (not equal to) 

select * 
from orders
where gloss_amt_usd > 1000
limit 5

select name, website, primary_poc
from accounts
where name = 'Exxon Mobil'

DERIVED COLUMN
common operators include: 
  1. * (Multiplication)
  2. + (Addition)
  3. - (Subtraction)
  4. / (Division)

select id, account_id, standard_amt_usd/standard_qty as unit_price
from orders
limit 10

LIKE
This allows you to perform operations similar to using WHERE and =, 
but for cases when you might not know exactly what you are looking for. 
  • Wildcards(%)
  • Case-sensitive

select * 
from orders
where account LIKE '%google%'

select name
from accounts
where name like 'C%'

IN
This allows you to perform operations similar to using WHERE and =, 
but for more than one condition.

select name, primary_poc,sales_rep_id
from accounts
where name in ('Walmart', 'Target', 'Nordstrom')

NOT
This is used with IN and LIKE to select all of the rows NOT LIKE or NOT IN a certain condition.

select name, primary_poc,sales_rep_id
from accounts
where name NOT in ('Walmart', 'Target', 'Nordstrom')

select *
from web_events
where channel NOT in ('organic', 'adwords' )

select name
from accounts
where name not like '%s'

AND & BETWEEN
These allow you to combine operations where all combined conditions must be true.

select * 
from orders
where standard_qty > 1000 
and poster_qty = 0
and gloss_qty = 0

select * 
from accounts
where name NOT LIKE 'C%' 
AND NAME NOT LIKE '%s'

select * 
from web_events
where channel in ('organic', 'adwords')
and occurred_at between '2016-01-01' and '2017-01-01'
order by occurred_at desc

OR
This allows you to combine operations where at least one of the combined conditions must be true.

select id
from orders
where gloss_qty > 4000 or poster_qty > 4000

select *
from orders
where standard_qty = 0 or (gloss_qty > 1000 or poster_qty > 1000)

select *
from accounts
where *name like 'C%' OR NAME LIKE 'W%' )
and (primary_poc LIKE '%ana%' or primary_poc LIKE '%Ana%')
and or primary_poc NOT LIKE '%eana%'


Summary
StatementHow to Use ItOther Details
SELECTSELECT Col1, Col2, ...Provide the columns you want
FROMFROM TableProvide the table where the columns exist
LIMITLIMIT 10 Limits based number of rows returned
ORDER BYORDER BY ColOrders table based on the column. Used with DESC.
WHEREWHERE Col > 5A conditional statement to filter your results 
LIKEWHERE Col LIKE '%me%'Only pulls rows where column has 'me' within the text 
INWHERE Col IN ('Y', 'N')A filter for only rows with column of 'Y' or 'N'
NOTWHERE Col NOT IN ('Y', 'N')NOT is frequently used with LIKE and IN
ANDWHERE Col1 > 5 AND Col2 < 3 Filter rows where two or more conditions must be true 
ORWHERE Col1 > 5 OR Col2 < 3Filter rows where at least one condition must be true
BETWEENWHERE Col BETWEEN 3 AND 5Often easier syntax than using an AND

Saturday, July 21, 2018

Spreadsheets 3: Visualize Data

Pie Charts:
- Show proportions
- Divide the whole pie into different pieces

Bar Charts:
Comparing category values against other values

Scatter and Line Plots:
- Useful for displaying bivariate numerical data.
- This means a data set with two variables, such as height and weight measurements for a list of human beings.

Histogram: 
- A column chart that measures the frequency of data in a data set.
- A histogram is only associated with quantitative data sets.

Box Plot: 
Visualization of data statistical spread including 1st, 2nd, and 3rd quartiles plus max and min.


When you are presenting data, think about: 
1. What questions are we answering?
2. What patterns are we trying to show?
3. Who is the audience?
4. Overview or in-depth?

Thursday, July 19, 2018

Spreadsheets2: Analyze Data

Aggregation Functions
= A1 + B1 + C1
= SUM(A1:C1)

SUM/ AVERAGE/ MAX/ MIN/ MEDIAN/ STANDARD DEVIATION(stdev)

Logical Functions
=IF(condition, value if TRUE, [value if FALSE])
=IF(AND(condition1, condition2, ...), value if TRUE, [value if FALSE])

Otherwise, mark it with "No".
AND: true if all conditions are true
OR: true if any condition is true
NOT: reverses true and false

ex)
=IF(OR(MAX(B2:D2)>10, SUM(B2:D2)>20), "Special Order", "No")
If the maximum number of any one fruit exceeds 10 pieces in an order, 
or the total order exceeds 20 pieces (all fruit),
then mark it with "Special Order".
Otherwise, mark it with "No".

Conditional Aggregation Functions
COUNTIF
=countif(A:A, "=apple")
SUMIF

Named Ranges
Creating named ranges is a lot more readable and easier to maintain.
How to create named ranges:
Formulas> Define Name


Vlookup: a function that uses a keyword and index to "look up" a value in a table
=VLOOKUP(A2,airline_lookup, 2, FALSE)
1) selecting a cell
2) selecting the range you are referring to -> here I used named ranges
3) Index of the column you are referring to
4) False -> exact match
True -> similar match

Spreadsheets1: Manipulate Data

Useful Data Cleaning Functions
concatenate
=CONCATENATE(B2, "    ", A2, "lives in ", C2, ".")

trim: makes multiple spaces to only one space

proper 
=PROPER("HELLO World")
output:
Hello World

upper/ lower: makes all letters upper/lower letters
=lower("HELLO WORLD"_
output: 
hello world

=upper("heLlo WorLD")
output: 
HELLO WORLD


Friday, July 13, 2018

Descriptive vs. Inferential Statistics

Descriptive Statistics:
about describing out collected data.

Inferential Statistics:
using our collected data to draw conclusions to a larger population.

1. Population - our entire group of interest.
2. Parameter - numeric summary about a population
3. Sample - a subset of the population
4. Statistic - numeric summary about a sample

Measures of Spread, Outliers, and Histogram

Measures of Spread
1. Range
2. Interquartile Range (IQR)
3. Standard Deviation
4. Variance

Histograms
- center
- spread
- shape
- outliers

Five Number Summary
Minimum: The smallest number in the dataset.
Q1: The value such that 25% of the data fall below.
Q2(= Median): The value such that 50% of the data fall below.
Q3: The value such that 75% of the data fall below.
Maximum: The largest value in the dataset.


Range
Max- Min

Interquartile Range
Q3 - Q1

Box Plot
Useful for quickly comparing the spread of two data sets


Standard Deviation
is one of the most common measures for talking about the spread of data.
It is defined as the average distance of each observation from the mean.


Variance:
The average squared difference of each observation from the mean
n1 i=1n (xi x¯)2


Shape of Histogram


Left Skewed: mean < median
-> "Skewed left" means that there are more points (well, more heavily weighted points) left of the mean.
Right Skewed: mean > median
-> more data points on the right

  • When we have data that follows a normal distribution, we can completely understand our dataset using the mean and standard deviation.
  • However, if our dataset is skewed, the 5 number summary (and measures of center associated with it) might be better to summarize our dataset.


Outliers
Points that fall very far from the rest of the data points.

Common Techniques for Outliers
1. Noting they exist and the impact on summary statistics.
2. If typo - remove or fix.
3. Understanding why they exist, and the impact on questions we are trying to answer about our data.
4. Reporting the 5 number summary values is often a better indication than measures like the mean and standard deviation when we have outliers.
5. Be careful in reporting. Know how to ask the right questions.

Variables

Random Variable: 

  • Placeholders for the possible values of some process.
  • Commonly use X, Y, Z to notate random variables.
    • Usually represented by capital letters. (X, Y, Z)


Observed Values: 

  • observed values for each variable(X, Y, Z)
    • usually represented by lowercase letters(x, y, z)


Summation:
i=1n xi


Notation for the Mean: 

- 1/n means the whole summation is divided by the no. of variables

n1 i=1n xi


Friday, July 6, 2018

Measures of Center: Mean, Median, Mode

There are four main aspects to analyzing Quantitative data.
  1. Measures of Center
  2. Measures of Spread
  3. The Shape of the data
  4. Outliers
Let’s focus on ‘Measures of Center’ in this post: Mean, Median, Mode.
1. Mean
  •  the average/ the expected value in mathematics.
  • can be calculated as
    • the sum  of all values / n (number of values in the dataset)
2. Median
  • splits our data so that 50% of our values are lower and 50% are higher
  • excludes outliers so it could be a more accurate measure if there is an outlier
  • sort all the data in an incremental order and find the middle value
  • if no. of dataset is odd — the direct middle
  • if no. of dataset is even — the average of the two values in the middle
3. Mode
  • the most frequent number in the data set
  • no mode: if all observations in our dataset are observed with the same frequency
    • (1,1,2,2,3,3,4,4)
  • many modes: if two (or more) numbers share the max value, then there is more than one mode. 
    • (1,2,3,3,3,4,5,6,6,6,7,8,9) -> two modes: 3, 6
Notation
  • a common language used to communicate mathematical ideas. Think of notation as a universal language used by academic and industry professionals to convey mathematical ideas. (+, -, /…etc.)
Properties of Notation
  • Understanding how to correctly use notation makes you see really smart.
  • It allows you to read the documentation, and implement an idea to your own problem.
  • It makes ideas that are hard to say in words easier to convey.
Cited from Digital Foundations Nanodegree, Udacity

SQL Joins

Database Normalization:  Are the tables storing logical groupings of the data? Can I make changes in a single location, rather than in...